The 4.2% Wall That Broke the Market's Back
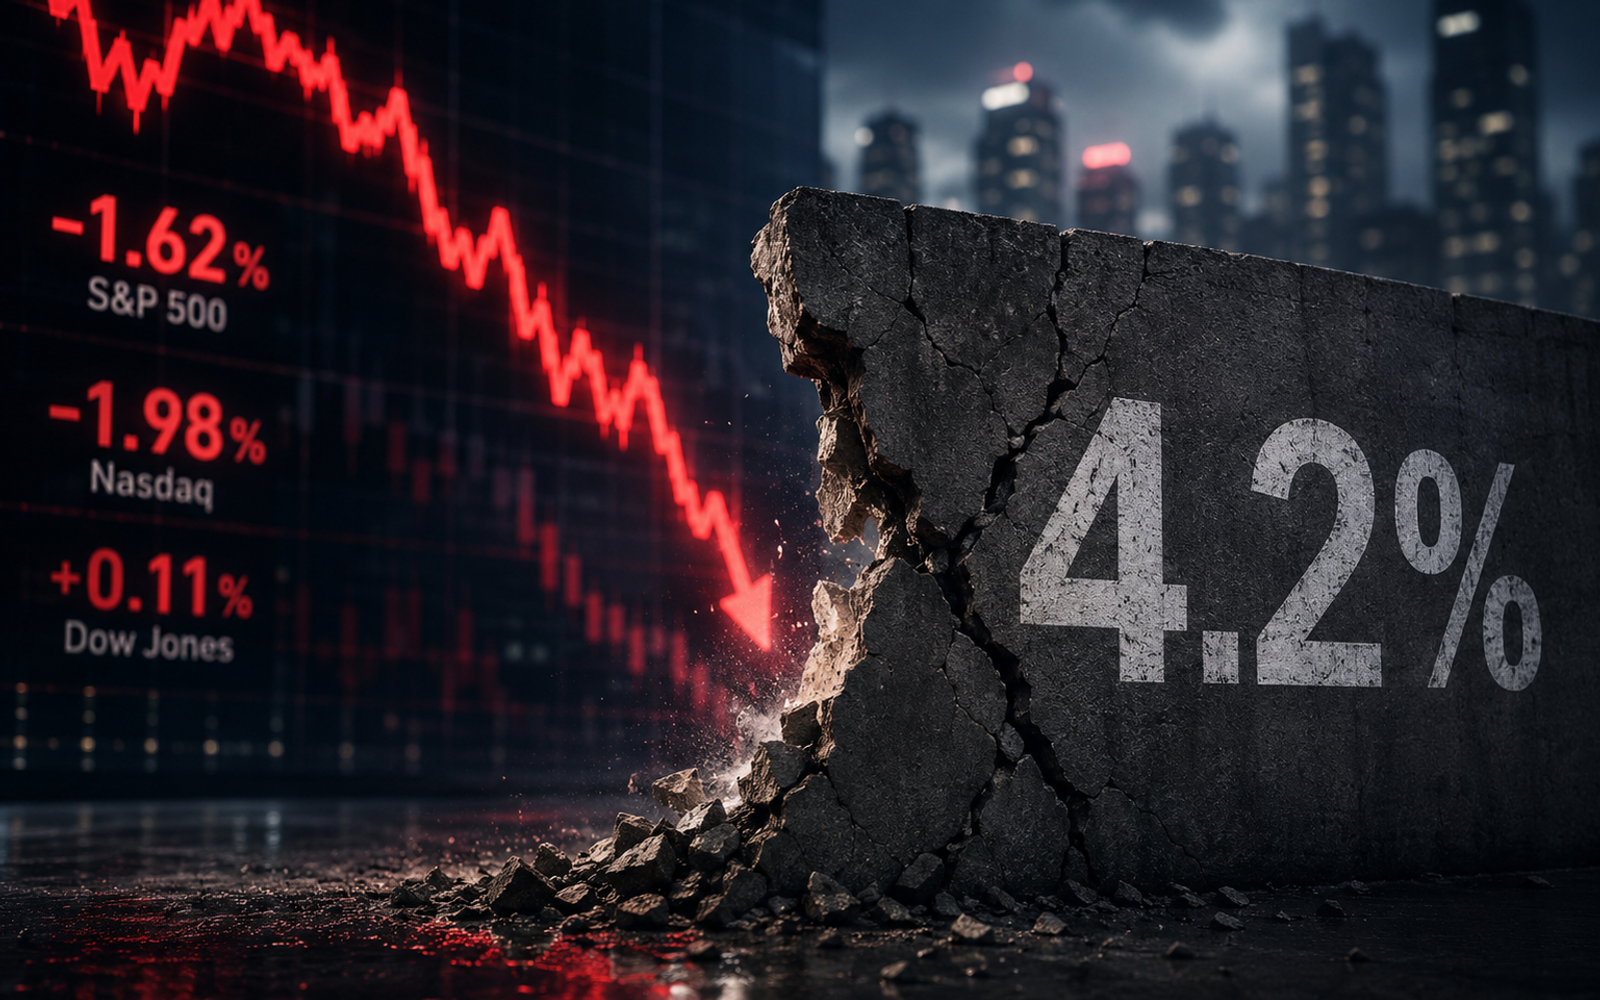
Inflation hit a three year high of 4.2%. The S&P 500 sold off 1.62% in a single session. Here is what comes next.

The sell off started quietly. Then it didn't stay quiet. By 10:30 AM Eastern on Tuesday, the S&P 500 had already shed 1.62%, the Nasdaq was down nearly 2%, and the Dow was barely clinging to green by the grace of a few defensive names. The trigger was a single number from the Bureau of Labor Statistics: 4.2%. That is the annual inflation rate for May 2026, the highest since April 2023, and it marks the third consecutive monthly acceleration in headline CPI. The market had braced for a hot number. It got one. What it hadn't braced for was the structural realization that this inflation cycle is not winding down. It is mutating.
I have been doing this long enough to know that one trading session is not a trend. But the composition of this sell off matters more than the magnitude. Technology stocks led the rout, with chip names like Micron and Broadcom dragging the entire sector lower. Nvidia fell 3.39% on the day. Caterpillar lost 6.34%. Honeywell dropped 4.57%. These are not speculative names. These are industrial and semiconductor bellwethers, the kind of stocks institutions hold because they believe in the long run. When those start to crack, you have to ask what changed. The answer is not the inflation number itself. The answer is what the inflation number implies about the next two years of policy, energy costs, and earnings.
The Energy Spiral Nobody Modeled
The headline number tells you what happened. The components tell you why. Energy costs jumped 23.5% year over year in May, up from 17.9% in April. That is not a rounding error. That is an accelerated energy shock layered on top of a sticky core inflation problem that refuses to resolve. Core CPI, which strips out food and energy, rose to 2.8% in April, its highest level in seven months. Strip away the energy spike and you still have a core inflation rate that is running well above the Federal Reserve's 2% target. The combination is the worst possible outcome for central bankers: a supply driven energy surge that they cannot fix with rate hikes, alongside a demand driven core inflation that they must fix with rate hikes.
The Iran war is the obvious culprit. Oil prices have surged roughly 55% since the conflict began, with WTI crude peaking at $94 per barrel in April and May. The Strait of Hormuz disruption, the sanctions regime, the uncertainty around the duration of the conflict, none of these factors are going to resolve in a quarter. The International Energy Agency described the situation as the greatest global energy security challenge in history. That is not hyperbolic language from a normally cautious agency. That is a factual description of a supply chain that has not been this constrained since the 1970s. And unlike the 1970s, we have a much more leveraged financial system sitting beneath it.
What the Sell Off Actually Tells Us
A 1.62% down day in the S&P 500 is not a crash. It is not even a correction. The broader index is still hovering near all time highs, supported by the AI trade, the SpaceX IPO mania, and a general sense that the US economy is more resilient than the rest of the world. The SpaceX IPO alone has drawn more than $70 billion in retail orders, which tells you that the animal spirits in the retail base are still very much alive. But that is precisely the problem. When retail is euphoric about a single stock and institutional investors are quietly reducing exposure to broad market indices, you have a divergence that usually resolves in one direction. It is not the direction retail expects.
Look at the volume data from Tuesday. The sell off was accompanied by above average trading volume across the S&P 500, with the heaviest concentration in technology and consumer discretionary names. That is the signature of institutional distribution, not panic. Institutions do not panic. They methodically reduce positions when the risk reward profile shifts. What shifted? The probability that the Federal Reserve will be able to cut rates this year has dropped from something close to 60% a month ago to effectively zero after this CPI print. The market had been pricing in a pivot. That pivot is now off the table. And if the pivot is off the table, then the valuation multiples that the market has been willing to assign to growth stocks become very difficult to justify.
The Liquidity Question That Keeps Getting Louder
Here is the number that keeps me up at night. The S&P 500 is trading at roughly 22 times forward earnings. The risk free rate is at 5.5%. The equity risk premium, the extra return you get for owning stocks instead of bonds, is negative. That is not normally a sustainable configuration. It can persist for a while if earnings are accelerating. But with energy costs eating into margins and the consumer showing signs of strain, the earnings picture for the second half of 2026 is deteriorating. I wrote about this last month in the context of corporate debt refinancing risk. The channel is becoming clearer now.
Companies that loaded up on cheap debt in 2020 and 2021 are facing refinancing costs that are 300 to 400 basis points higher. That hits interest expense. Interest expense hits net income. Net income hits stock prices. It's a chain that moves slowly until it doesn't. The sell off on Tuesday may turn out to be a blip. But it may also be the first time the market priced in a scenario where inflation stays above 3.5% through the end of 2026 and the Fed does nothing. That scenario has real consequences for portfolio construction. It means bonds are not a hedge. It means growth stocks are vulnerable. It means the only thing that works is cash and commodities, and cash is yielding 5.5%, which is not nothing.
Policy Traps on Both Sides of the Atlantic
The ECB already moved. On the same day the US inflation data landed, the European Central Bank raised rates by a quarter point to 2.25%, lifting its inflation forecast in the process. The decision was driven largely by the energy spillover from the Iran conflict, which is hitting Europe harder than the US. ECB Governing Council member Pierre Wunsch made it clear that further hikes are quite likely if the war remains unresolved. The ECB is now in a tightening cycle at a time when large parts of the eurozone economy are flirting with recession. That is not a policy error. It is a constraint. They have no good options.
The Fed faces a similar trap but with different timing. The US economy is stronger, which means the Fed can afford to hold rates where they are without immediately triggering a recession. But the longer rates stay high, the more stress builds in the regional banking sector, the commercial real estate market, and the consumer credit space. The data we already have shows that credit card delinquencies are rising.
Auto loan delinquencies are rising. Small business confidence is deteriorating. None of these are crisis level yet. But they are all moving in the wrong direction, and they have been moving in that direction for months.
What the inflation report does is remove the possibility that the Fed will ride to the rescue. The market had been nursing a hope that the Fed would cut rates in September or November, just in time to boost the economy ahead of the presidential election. That hope is now gone. And when hope is removed from markets, the adjustment is rarely orderly. It is not a crash. It is a slow repricing that happens day after day, with each session shaving a little more off the valuations that were built on the assumption that rates would be lower.
The Redistribution Beneath the Surface
One of the more interesting dynamics happening inside this sell off is the rotation out of passive index exposure and into active sector bets. The SPY, the largest S&P 500 ETF, saw net outflows of roughly $3.8 billion in the week leading up to the CPI print. Meanwhile, sector specific funds focused on energy, healthcare, and defense saw inflows. That is a signal. It says that the broad bet on US equities is being replaced by targeted bets on specific parts of the economy that benefit from the current environment. Energy obviously wins from higher oil prices. Defense wins from geopolitical instability. Healthcare wins from demographic trends that have nothing to do with the business cycle.
But the rest of the market is getting squeezed. Consumer discretionary, technology, real estate, these sectors depend on low rates, cheap energy, and confident consumers. They are now getting none of the three. The retail rotation into SpaceX and a handful of AI names is a distraction from the underlying weakness in the broad market. It is also a risk concentration. When $70 billion in retail orders chase a single IPO, you have to ask what those buyers are selling to free up the cash. The answer, based on the data from Tuesday, is that they are selling everything else.
The Valuation Reset Nobody Wants to Admit Is Coming
Here is the math that bothers me. The S&P 500's forward P/E ratio of 22x assumes that earnings will grow at roughly 10% annually over the next two years. But energy costs alone could shave 2% to 3% off earnings growth for every $10 increase in oil prices. With oil sitting at $94 per barrel and showing no signs of retreat, the earnings growth assumption begins to look aggressive. If earnings come in flat this year, which is a very real possibility, then the market is actually trading at 22x current earnings, not forward earnings. That is expensive by any historical standard. The average forward P/E over the last 20 years is roughly 16x. The current multiple implies a level of confidence in the economic trajectory that the data simply does not support.
None of this means you should sell everything and hide in cash. Cash is a position. It has real opportunity cost. But it does mean that the risk reward profile for passive long equity exposure has shifted meaningfully. The probability of a 10% correction over the next six months is higher than it was three months ago. The probability of a 20% drawdown is higher than it was six months ago. These are not predictions. They are probabilities derived from the data and the policy constraints. The market is repricing the path of inflation from transitory to sticky to entrenched. Each step of that repricing brings lower prices for risk assets and higher demand for safe havens.
The sell off on Tuesday was not a crash. It was a signal. It was the market saying that the old narrative, the one where inflation fades, the Fed cuts, and stocks rally, is no longer operative. The new narrative is still being written. But the first paragraph is clear. Inflation at 4.2% changes the trajectory of everything that follows. The next 12 to 24 months will be defined not by recovery but by adaptation. And adaptation, in markets, always comes with a cost that is distributed unevenly.
--- *Disclaimer: This article is for informational purposes only and does not constitute financial advice. Past performance is not indicative of future results. Consult a qualified financial advisor before making investment decisions.*
Comments (0)
No comments yet. Be the first to share your thoughts.